- Visibility 374 Views
- Downloads 39 Downloads
- Permissions
- DOI 10.18231/j.ijceo.2021.110
-
CrossMark

Abstract
Introduction: The study is conducted to determine the functional and structural differences between NTG and POAG, to assess the rate of conversion of NTG into POAG and its early intervention.
Materials and Methods: It is a hospital based prospective, cross-sectional study of 56 NTG and 56 POAG patients. History was taken and comprehensive ophthalmic examination with glaucoma work up was done.
Results: Majority of the patients belonged to the age group between 51 and 60 years i.e. 48.2% in NTG and 62.5% in POAG. Majority of the NTG patients i.e. 33 (58.9%) were females while 41(73.2%) were males in POAG. 40% of NTG patients had systemic association like bronchial asthma, diabetes, hypertension, ischemic heart disease and migraine. There was no significant difference in CDR between two groups. Inferior & temporal neuroretinal rim thinning was more common in NTG. While bipolar thinning & superior rim thinning was more common in POAG. There is significantly more thinning of RNFL in POAG than NTG. The mean deviation (MD) & pattern standard deviation (PSD) in visual fields between NTG & POAG showed no significant difference. Whereas the field loss was near centre of fixation in NTG group compared to POAG which was diffuse.
Conclusion: These differences between NTG and POAG suggest that the pathogenesis of NTG includes IOP and IOP independent risk factors, while IOP is the main risk factor in POAG. The parameters assessed determine the risk and progression of NTG to POAG.
Introduction
Glaucoma is progressive optic neuropathy that causes characteristic changes of the optic nerve and visual field in relation to intraocular pressure (IOP).[1]
Primary open angle glaucoma (POAG) has normal-appearing anterior chamber angle, increased intraocular pressure (IOP) with glaucomatous optic nerve damage and characteristic visual field loss.[2] NTG differs from POAG only in that the IOP is consistently <21mmHg.
This study aims at determining the differences in functional and structural deficits in NTG and POA and rate of progression of NTG into POAG.
Materials and Methods
Patients attending the department of Ophthalmology at Minto Ophthalmic Hospital, screened during the period Nov 2016 – Aug 2019 & patients fulfilling the criteria like Gonioscopy showing open-angles, Optic nerve cupping and corresponding visual field defects were taken into study. Diurnal IOP was recorded and subjects divided into two groups based on the readings. Patients with <21mmHg IOP (56) were put in NTG group and those of >21mmHg (56) were grouped into POAG group. Written informed consent was taken. Ethical committee clearance was obtained.
Ocular hypertensives, patients with Primary angle-closure glaucoma, Secondary glaucoma, Corneal disorders, Posterior-segment pathologies and Non-glaucomatous optic neuropathy were excluded from the study.
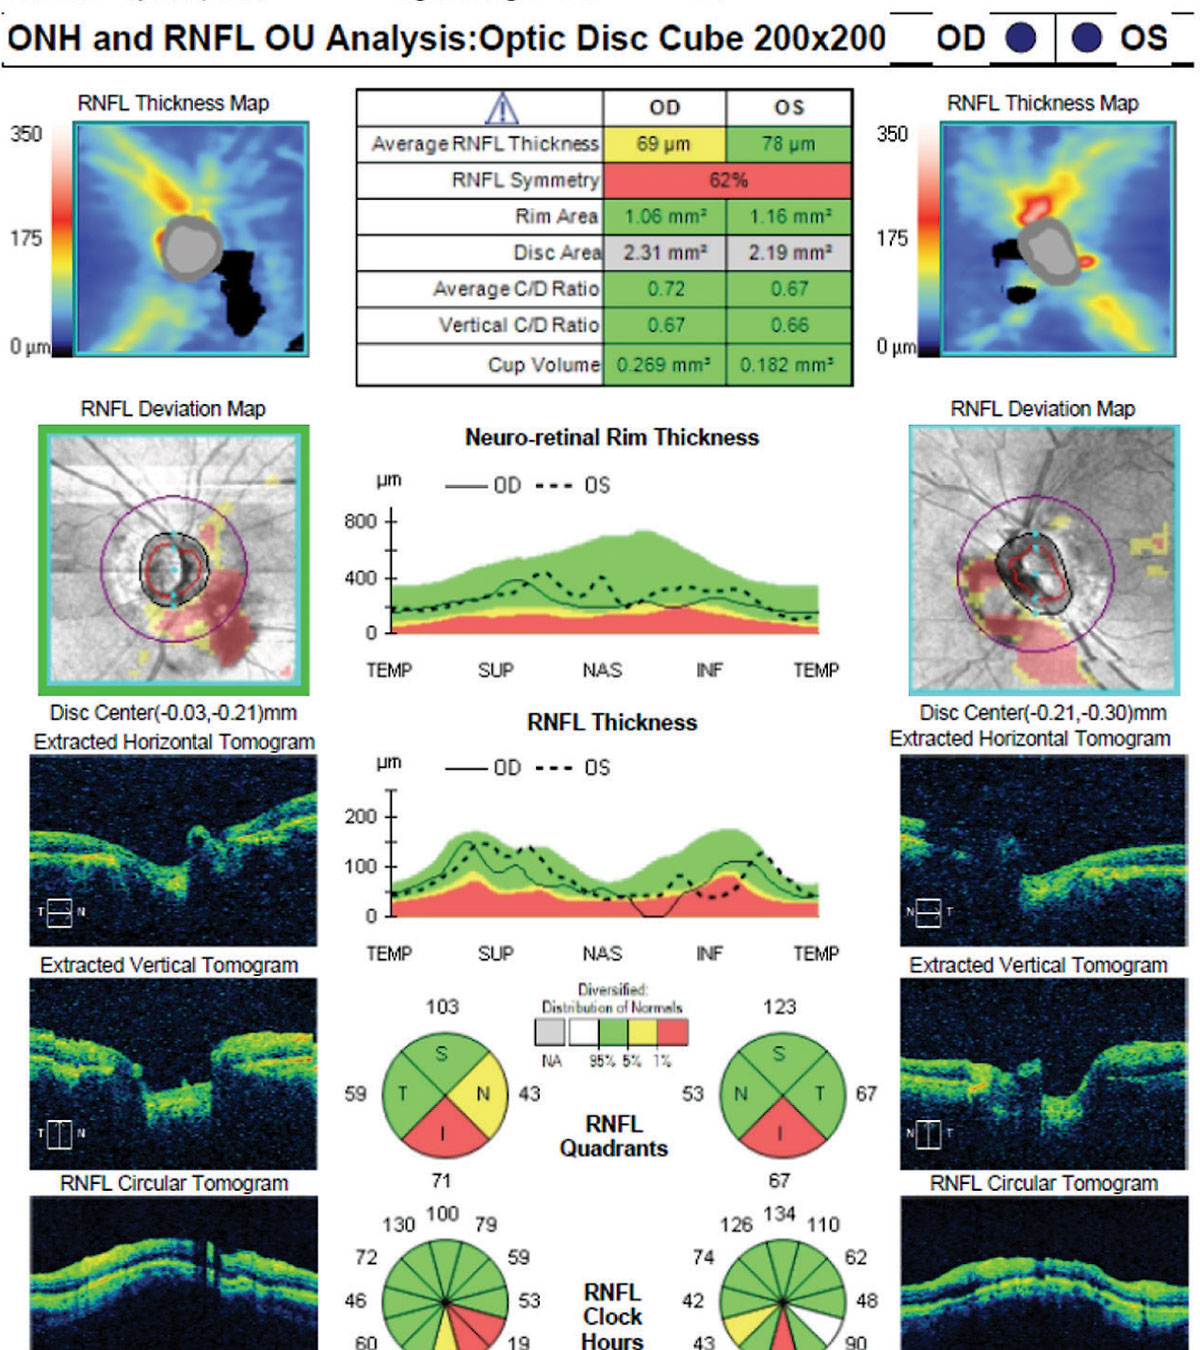
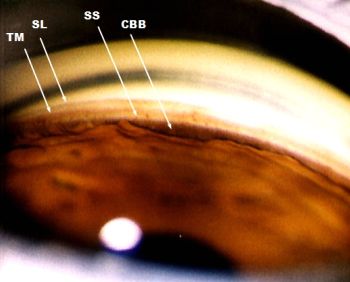
Detailed history was taken from all the patients and ocular examination of both eyes was done, which included visual acuity with Snellen’s chart, Slit-lamp biomicroscopy, IOP was measured using Goldmann applanation tonometer, Indirect Gonioscopy using Goldmann three mirror lens, optic disc evaluation was done with slit-lamp biomicroscopy using by 78 D, Time domain OCT (Zeiss Cirrus HD OCT) done to asses RNFL parameters, Pachymetry was done and Visual fields assessment were done using Zeiss Humphrey field- analyser. Each patient was followed-up till 34 months.
Results
Statistical software namely SAS 9.2, SPSS 15.0, Stata 10.1, MedCalc 9.0.1, Systat 12.0 and R environment ver.2.11.1 are used for the analysis of the data. Student t test, Chi-square test / Fisher Exact test were used to study the significance of study parameters. Leven’s test was performed to assess the homogeneity of Variance. P-value of 0.05 was considered as significant.
Mean age was found to be 58.96 yrs in NTG and 55.07 in POAG. NTG was more common in females (58.9%), whereas POAG was more common in males (73.2%). Systemic involvement was more common in NTG (71.4%) with diabetes in 42.9% (24), hypertension in 25% (14), bronchial asthma and migraine in 1.8% each (1).
There was no significant difference in CDR between two groups.
Temporal (32.1%) and inferior (39.3%) NRR thinning was more common in NTG, whereas bipolar thinning (57.1%) was more common in POAG. Retinal Nerve Fiber Layer (RNFL) was significantly thinner in POAG in all four quadrants.
There were no significant changes in MD and PSD values of Visual fields (VF) between NTG and POAG. NTG showed localized field defects which were closer to centre of fixation, while it was diffuse and denser in POAG.
|
Character |
NTG |
POAG |
P value |
|
Mean age |
58.96 Yrs |
55.07 Yrs |
0.002 |
|
Sex |
58.9% (33) Female 41.1% (23) Male |
26.8% (15) Female 73.2% (41) Male |
0.001 |
|
Systemic involvement |
71.4% (40) |
50% (28) |
0.020 |
|
Mean Disc CDR |
NTG |
POAG |
|
Right Eye |
0.69±0.11 |
0.73±0.09 |
|
Left Eye |
0.71±0.11 |
0.76±0.11 |
|
|
NTG |
|
|
POAG |
|
|
Disc NRR |
Right Eye |
Left Eye |
Disc NRR |
Right Eye |
Left Eye |
|
WNL |
8(14.3%) |
4(7.1%) |
WNL |
1(1.8%) |
1(1.8%) |
|
Temporal thinning |
17(30.4%) |
18(32.1%) |
Temporal thinning |
13(23.2%) |
4(7.1%) |
|
Bipolar thinning |
6(10.7%) |
8(14.3%) |
Bipolar thinning |
23(41.1%) |
32(57.1%) |
|
IR Thinning |
21(37.5%) |
22(39.3%) |
IR Thinning |
3(5.4%) |
0(0%) |
|
Superior thinning |
1(1.8%) |
2(3.6%) |
Superior thinning |
16(28.6%) |
16(28.6%) |
|
Superior notch |
2(3.6%) |
1(1.8%) |
Superior notch |
0(0%) |
0(0%) |
|
All rims thinned |
1(1.8%) |
1(1.8%) |
All rims thinned |
0(0%) |
0(0%) |
|
Inferior thinning |
0(0%) |
0(0%) |
Inferior thinning |
0(0%) |
3(5.4%) |
|
P value |
<0.001** Right Eye |
<0.001** Left Eye |
|
RNFL |
NTG |
POAG |
P value |
|
Superior Quadrant |
82.76±16.9 |
63.73±12.59 |
<0.001** |
|
Inferior quadrant |
88.05±14.55 |
59.98±7.14 |
<0.001** |
|
Nasal quadrant |
54.66±8.18 |
46.04±6.80 |
<0.001** |
|
Temporal quadrant |
54.11±5.58 |
45.09±5.96 |
<0.001** |
|
Average thickness |
69.90±6.61 |
53.71±6.31 |
<0.001** |
|
Visual Fields |
NTG |
POAG |
P value |
|
Right Eye |
|
|
|
|
MD (dB) |
-17.14±7.25 |
-18.79±8.08 |
0.261 |
|
Mean PSD |
9.27±3.50 |
11.42±3.85 |
0.003** |
|
Left Eye |
|
|
|
|
MD (dB) |
-16.22±6.88 |
-17.56±6.75 |
0.303 |
|
Mean PSD |
9.38±2.80 |
11.07±3.52 |
0.006** |
On follow up, two patients of NTG had raised IOP and were converted to POAG. No significant changes were observed in VF and RNFL on follow up.
Discussion
NTG & POAG are two extremes of pressure-independent & dependent glaucomatous optic nerve damage. NTG is a condition with glaucomatous optic disc, visual field changes, an open-angle with normal range of IOP. IOP is a part of the pathogenic process in NTG & factors other than IOP may contribute to optic nerve damage by making the nerve susceptible to damage at lower IOP levels.
In our study, it was found that majority of the patients i.e., 48.2% in NTG and 62.5% in POAG, belonged to the age group between 51 and 60 years (mean age of 58.96 yrs in NTG and 55.07 yrs in POAG). NTG was found to be more common in females i.e., 58.9% (33 patients) and POAG more common in males i.e., 73.2% (41 patients).
The optic disc CDR & NRR was examined between NTG & POAG. There was no significant difference in CDR between two groups whereas in disc NRR inferior & temporal rim thinning was more common in NTG. While bipolar thinning & superior rim thinning was more common in POAG.
In our study, it was found that systemic association for NTG (40%) was more common than POAG (28%). This is similar to a study done by Kristy G et al, in which 38% of NTG patients were associated with Migraine, Raynaud’s and hypotension, while 42% of NTG were associated with cardiovascular disease.[3] The optic disc drance hemorrhage was found in NTG (9%) patients, unlike POAG & it was found to be associated with Diabetes mellitus & Hypertension.
In our study, the Mean RNFL thickness in superior quadrant is 85.82 ± 15.84 (NTG), 64.18 ± 14.42 (POAG); Inferior quadrant 86.64 ± 16.10 (NTG), 60.55 ± 8.26 (POAG); Nasal quadrant 54.29 ± 8.38 (NTG), 46.27 ± 6.93 (POAG) and Temporal quadrant 53.32 ± 5.98 (NTG), 45.38 ± 6.17 (POAG). Average thickness was 70.02 ± 6.14 (NTG) & 54.09 ± 6.84 (POAG). RNFL thickness by OCT gives an objective & quantitative assessment of glaucomatous structural loss.
Mean RNFL values by OCT of subjects in different studies.
|
Study |
NTG |
POAG |
OHT |
GS |
Normal |
|
This study |
82.76 ± 16.9 |
63.73 ± 12.59 |
- |
|
- |
|
Satyaprakash S et al [4] |
77.8 ± 30.58 |
65.45 ± 27.86 |
- |
106.75 ± 16.47 |
|
|
Study |
NTG |
POAG |
OHT |
GS |
Normal |
|
This study |
88.05 ± 14.55 |
59.98 ± 7.14 |
- |
|
- |
|
Satyaprakash S et al [4] |
92.6 ± 30.42 |
65.68 ± 32.89 |
- |
103.62 ± 16.47 |
- |
|
Study |
NTG |
POAG |
OHT |
GS |
Normal |
|
This study |
54.66±5.58 |
46.04±6.80 |
- |
- |
- |
|
Satyaprakash S et al[4] |
49.6±13.99 |
44.91±23.79 |
- |
63.95±11.12 |
- |
|
Study |
NTG |
POAG |
OHT |
GS |
Normal |
|
This study |
54.11±5.58 |
45.09±5.96 |
- |
- |
- |
|
Satyaprakash S et al |
54.7±12.99 |
42.84±18.86 |
- |
57±11.77 |
- |
|
Study |
NTG |
POAG |
OHT |
GS |
Normal |
|
This study |
69.90±6.61 |
53.71±6.31 |
- |
- |
- |
|
Satyaprakash S et al [4] |
70.1±17.81 |
55.26±19.75 |
- |
82.29±10.66 |
- |
We compared the mean deviation (MD) & pattern standard deviation (PSD) in visual fields between NTG & POAG. There was no significant difference between the two, similar to previous studies. We found that field loss was near centre of fixation in NTG, compared to POAG, which was diffuse.
|
Study |
NTG |
POAG |
HTG |
PXFG |
|
This study |
|
|
- |
- |
|
Michele Iester et al [5] |
-6.31±13.2 |
|
-7.69±5.02 |
- |
|
Oraorn Thonginnetra et al [6] |
-3.61±2.08 |
|
-4.47±2.60 |
- |
The mean MD of our study was not comparable with other studies.
|
Study |
NTG |
POAG |
|
This study |
|
|
|
Michele Iester et al [5] |
7.08±4.16 |
7.52±3.38 |
|
Oraorn Thonginnetra et al [6] |
2.82±3.54 |
4.98±2.46 |
The mean PSD of NTG was comparable to Michele Lester et al while that of POAG was not comparable to previous studies.
Patients were followed up for 34 months, where IOP, Visual fields (VF) and OCT for RNFL was done. We found no significant difference in VF and RNFL, but two patients of NTG were converted to POAG due to raised IOP on follow up.
The results of this study were comparable with the variables of other similar studies. Hence, our study plays a significant role in assessing the parameters which may be noticed in NTG and POAG, which can assess the risk and reduce the further progression of the disease. Further medical and surgical management can also be planned for the same.
Source of Funding
None.
Conflict of Interest
None.
References
- Satyaprakash S, Vinai S, Kumar S, Shivangi S, Kamaljeet S, Jagriti R. A comparison of retinal nerve fibre layer thickness by spectral domain optical coherence tomography in primary open angle glaucoma, normotensive glaucoma and glaucoma suspect. J Ophthalmol. 2018;3(5). [Google Scholar]
- Song B, Caprioli J. New directions in the treatment of normal tension glaucoma. Indian J Ophthalmol. 2014;62:529-37. [Google Scholar]
- Kanski J. . Clinical ophthalmology. 2016. [Google Scholar]
- Ahrlich K, Moraes CD, Teng C, Prata T, Tello C, Ritch R. Visual field progression differences between normal tension and exfoliative high-tension glaucoma. Invest Ophthalmol Vis Sci. 2010;51(3):1458-63. [Google Scholar]
- Iester M, DeFeo F, Douglas G. Visual Field Loss Morphology in High and Normal-Tension Glaucoma. J Ophthalmol. 2012;2012. [Google Scholar] [Crossref]
- Thonginnetra O, Gareenstein V, Chu D, Liebmann J, Ritch R, Hood D. Normal versus high tension glaucoma: A comparison of functional and structural defects. J Glaucoma. 2010;19(3):151-7. [Google Scholar]