- Visibility 17 Views
- Downloads 4 Downloads
- DOI 10.18231/j.ijceo.2020.053
-
CrossMark

A study of systemic factors affecting diabetic retinopathy in type 2 diabetes mellitus
Introduction
Diabetic retinopathy (DR) is a major cause of blindness among the working age group.[1] In India, diabetic retinopathy is rapidly increasing, becoming an important cause of visual disability. Visual disability from diabetes is a significant public health problem; however this morbidity is largely preventable and treatable. In the Indian subcontinent, only limited data are available on the prevalence of DR in the general population. Aravind Comprehensive Eye Study reported the prevalence of DR (in self-reported subjects with diabetes) in rural South India to be 10.5%.[2] The Chennai Urban Rural Epidemiology Study (CURES) reported the prevalence of DR in urban Chennai to be 17.6% in diabetic population. The prevalence of diabetic retinopathy was 18% in an urban population with diabetes mellitus in India. The duration of diabetes is the strongest predictor for diabetic retinopathy.[3]
Epidemiological surveys have shown that various risk factors known to be associated with diabetic retinopathy, tend to accelerate its course and increase its severity. Studies have shown varying results when predicting gender as a risk factor for developing DR. In the clinic cohort in Chennai DR appeared to be prevalent more in the males compared to females (sex ratio 2: 1).[4] A similar preponderance has been reported from the CURES Eye study, [3] UKPDS study[5] and the Hyderabad study.[6], [7] The duration of diabetes is probably the strongest predictor for development and progression of retinopathy. In India, virtually all studies have shown an increased prevalence of DR as the duration of diabetes increased.[3] In the study conducted by Dandona et al. in type 2 diabetes, it is reported that 87.5 percent of those with >15 yr duration of diabetes had DR.
Increased blood pressure has been hypothesized, through the effects of increased shearing stress of blood flow, to damage the retinal capillary endothelial cells in the eyes of people with diabetes.[8] The possible mechanisms by which hypertension may affect DR are haemodynamic (impaired autoregulation and hyperperfusion) and through VEGF (vascular endothelial growth factor). This hypothesis has been supported by observations from clinical studies which showed an association between hypertension and the presence and severity of retinopathy in people with diabetes.[9], [10] The UKPDS showed that the incidence of retinopathy was associated with systolic blood pressure, while in the WESDR, diastolic blood pressure was a significant predictor of progression of diabetic retinopathy to PDR over 14 year of follow up in patients with type 1 diabetes. In the Indian context, hypertension was not a significant confounding factor in the CURES Eye study, however uncontrolled hypertension did influence the progression of DR.[3]
Individuals with elevated total serum cholesterol, low-density lipoprotein (LDL) cholesterol or triglyceride levels are more likely to have or develop retinal hard exudates, which can be associated with risk of vision loss, independent of the extent of macular oedema.[11] Several investigators have reported on the association of lipids with DR, but the results have not been consistent. The ETDRS group found a statistically significant association between elevated serum total cholesterol and LDL cholesterol and the severity of retinal hard exudation in patients with DR. Rema et al in a study showed an association of DME in type 2 diabetic subjects with increased LDL levels.[12] Other studies have demonstrated that decreasing dietary polyunsaturated fats may have an association with shrinkage of exudates and a treatment apt to lower plasma lipid levels reduced the risk size of perimacular hard exudates. It has also been shown that in type 2 diabetic subjects there was an increase in the lipid peroxidation in plasma and this is accentuated in patients with diabetic complications. A recent paper from the CURES eye study showed an association of DR with total cholesterol and serum triglycerides.[3] This association was maintained even after adjusting for age, as age by itself is a significant risk factor for hyperlipidaemia. The other significant finding in type 2 diabetes was that DME also showed a strong correlation with high LDL levels in the study.
Recent studies have shown that DR may not only be associated with glycaemic control and blood pressure, but also to body mass index (BMI) in patients with type 2 diabetes.[13], [14] Perhaps variation in ethnicity may explain the fact that BMI did not manifest as a risk factor for DR in the CURES Eye study. On the contrary subjects with type 2 diabetes and PDR had a lower BMI. Zhang et al. in the diabetes control and complications trial (DCCT) observed that besides diabetes duration and metabolic control, BMI had a significant predictive value in developing retinopathy.[15]
Materials and Methods
A hospital based observational analytical cross sectional study was conducted in a tertiary hospital and research centre in Pimpri Pune from the period of September 2017 to August 2019 after clearance from the ethics committee of the institute. Well informed consent was procured from all the subjects. The study was conducted in a total of 140 subjects in the age group of 40-75 years including both the sexes. The inclusion criteria was non-insulin dependent diabetic patients in the age group of 40-75 years. Exclusion criteria was patients with type 1 diabetes mellitus, high myopes, patients with vitreo retinal degenerations and dystrophies, patients in hypertensive emergencies, or with active infections or patients having ocular diseases like hazy media and uveitis and patients with retinal diseases like retinal vascular oclusins or retinitis pigmentosa.
Participant Information Sheet(PIS) regarding details of study were prepared in English, Marathi and Hindi languages. PIS was given to the participants and they were explained about the type and purpose of study according to the language best understood. After due consent only they were enrolled in the study
Patients’ rights for participation in the study were safeguarded. Participation in the study was voluntary. Participants were free to withdraw from the study at any point without giving any reason and without any loss to medical care.
Vision was assessed using illuminated Snellen's Chart. Detailed fundus examination was done in a dark room with indirect ophthalmoscope, direct ophthalmoscopy, and slit lamp biomicroscopy with +78D lens. Fundus camera was used to obtain a fundus photograph. Participants were segregated into 2 categories for the purpose of deriving the occurrence of retinopathy; Group 0: With diabetic retinopathy of any stage, Group 1: Without diabetic retinopathy. For grading the severity of retinopathy, Early Treatment of Diabetic Retinopathy Study (ETDRS) protocol was used.
All participants had their weight and height measured. A measuring scale and a digital weight scale was used for the same. Participants were asked to remove any footwear and heavy articles before testing. Calculation of BMI was done as weight (in kilograms) divided by the height in meters squared (kg/m2). BMI ≥ 25kg/m2 was defined as obesity.
Each participants Blood Pressure measurement was done with a manual sphygmomanometer. Two measurements were recorded for both systolic (SBP) and diastolic (DBP) BP. The average of the two BP measurements was then used for the analysis. Hypertension was considered when the value of SBP was found to be more than 140 mm Hg or DBP value was found to be 90 mm Hg.
Serum lipid measurement was done using fasting samples, to analyze total cholesterol, triglycerides and cholesterol components and. For analysis dyslipidemia was defined as, Triglyceride levels >150mg/dl, serum total cholesterol >160mg/dl, HDL<40mg/dl and LDL levels >100mg/dl.
Accordingly, the above mentioned variables were measured and noted carefully. Group subject investigations were compared for association and significance. Results and conclusion were drawn from the same.
All details of participants were kept under strict confidentiality. Analysis was also anonymous and all personal identifiers were removed. Microsoft Excel was used to enter data and statistical analysis was done using software SPSS version 2.0. Analysis of quantitative data was done in terms of Means and Standard Deviation. Analysis of qualitative data was done with appropriate test of significance like t-test.
Results
Mean age of subjects with diabetic retinopathy was 56.26 years with standard deviation of 6.76 years, with the highest 70 years and lowest 42 years. There were 40 (57%) females and 30 (43%) males in this group. 35 (50%) subjects were from 51-60 years age group followed by 19 (27.14%) subjects in 41-50 years age group. Mean age of subjects without diabetic retinopathy was 58.99 years with standard deviation of 7.47 years, with the highest 74 years and lowest 40 years. There were 46 (66%) females and 24 (46%) males in this group. 29 (41.43%) samples were from 61-70 years age group followed by 26 (37.14%) subjects in 51-60 years age group. Mean age of subject with diabetic retinopathy was lower than mean age of subjects without retinopathy and difference was found to be statistically significant (p = 0.025).
Mean duration of diabetes mellitus among retinopathy subject was higher than subjects without retinopathy and difference was found to be statistically significant (p = 0.004).
Mean glycosylated haemoglobin levels were found to be higher among retinopathy group than subjects without retinopathy and difference was found to be statistically significant (p = 0.001).
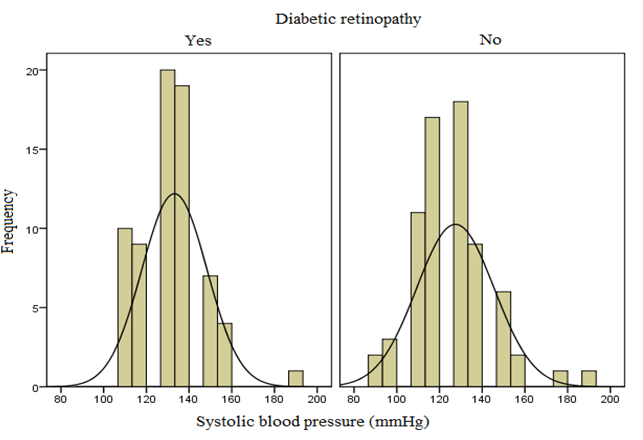
Mean systolic blood pressure among retinopathy subject was higher than subjects without retinopathy and the difference was found to be statistically significant (p = 0.046), and no significant difference in diastolic blood pressure was found amongst the two groups (p = 0.358).
Mean lipid level among retinopathy subject was not significantly different than subjects without retinopathy (p > 0.05).
Mean body mass index among retinopathy subject was not significantly different than subjects without retinopathy (p = 0.996).
| Variable | Diabetic Retinopathy | N | Mean | Std. Deviation | Std. Error Mean |
| Age | No | 70 | 58.99 | 7.473 | 0.893 |
| Yes | 70 | 56.26 | 6.758 | 0.808 |
| t-test for Equality of Means | ||||||
| T | df | Sig. (2-tailed) | Mean Difference | Std. Error Difference | 95% Confidence Interval of the Difference | |
| Lower | Upper | |||||
| 2.266 | 138 | 0.025 | 2.729 | 1.204 | .347 | 5.110 |
| t-test for Equality of Means | ||||||
| t | df | Sig. (2-tailed) | Mean Difference | Std. Error Difference | 95% Confidence Interval of the Difference | |
| Lower | Upper | |||||
| -2.969 | 138 | 0.004 | -2.686 | .905 | -4.474 | -.897 |
| Levene’s Test for equality of variances | t-test for Equality of Means | ||||||||
| F | Sig. | t | df | Sig. (2-tailed) | Mean Difference | Std. Error Difference | 95% Confidence Interval of the Difference | ||
| Lower | Upper | ||||||||
| Equal Variances assumed | 3.853 | 0.052 | 5.868 | 138 | 0.001 | 1.478 | 0.251 | 0.980 | 1.976 |
| Equal variances not assumed | 5.868 | 126.709 | 0.000 | 1.478 | 0.251 | 0.979 | 1.977 |
| Variable | Diabetic Retinopathy | N | Mean | Std. Deviation | Std. Error Mean |
| Systolic BP | No | 70 | 127.43 | 18.153 | 2.170 |
| Yes | 70 | 133.13 | 15.273 | 1.826 | |
| Diastolic BP | No | 70 | 79.29 | 10.811 | 1.292 |
| Yes | 70 | 80.86 | 9.285 | 1.110 |
| t-test for Equality of Means | |||||||
| Variable | T | df | Sig. (2-tailed) | Mean Difference | Std. Error Difference | 95% Confidence Interval of the Difference | |
| Lower | Upper | ||||||
| Systolic BP | -2.010 | 138 | 0.046 | -5.700 | 2.835 | -11.307 | -.093 |
| Diastolic BP | -.923 | 138 | 0.358 | -1.571 | 1.703 | -4.939 | 1.797 |
| Variable | Diabetic Retinopathy | N | Mean | Std. Deviation | Std. Error Mean |
| Cholesterol | No | 70 | 148.61 | 41.917 | 5.010 |
| Yes | 70 | 147.04 | 45.604 | 5.451 | |
| Triglycerides | No | 70 | 138.94 | 88.670 | 10.598 |
| Yes | 70 | 150.59 | 83.975 | 10.037 | |
| HDL | No | 70 | 37.17 | 11.413 | 1.364 |
| Yes | 70 | 36.50 | 10.665 | 1.275 | |
| LDL | No | 70 | 88.18 | 33.097 | 3.956 |
| Yes | 70 | 94.91 | 33.428 | 3.995 |
| t-test for Equality of Means | |||||||
| Variable | T | df | Sig. (2-tailed) | Mean Difference | Std. Error Difference | 95% Confidence Interval of the Difference | |
| Lower | Upper | ||||||
| Cholesterol | .212 | 138 | 0.832 | 1.571 | 7.403 | -13.067 | 16.210 |
| Triglycerides | -.798 | 138 | 0.426 | -11.643 | 14.597 | -40.505 | 17.219 |
| HDL | .362 | 138 | 0.718 | .676 | 1.867 | -3.016 | 4.367 |
| LDL | -1.198 | 138 | 0.233 | -6.736 | 5.622 | -17.853 | 4.382 |
| Variable | Diabetic Retinopathy | N | Mean | Std. Deviation | Std. Error Mean |
| BMI | No | 70 | 23.740 | 3.323 | 0.397 |
| Yes | 70 | 23.737 | 3.323 | 0.397 |
| Levene’s Test for equality of variances | t-test for Equality of Means | ||||||||
| F | Sig. | t | Df | Sig. (2-tailed) | Mean Difference | Std. Error Difference | 95% Confidence Interval of the Difference | ||
| Lower | Upper | ||||||||
| Equal Variances assumed | 0.240 | 0.625 | -0.005 | 138 | 0.996 | -0.003 | 0.559 | -1.108 | 1.102 |
| Equal variances not assumed | -0.005 | 137.990 | 0.996 | -0.003 | 0.559 | -1.108 | 1.102 |
Discussion
Mean age of subjects with diabetic retinopathy was 56.26 years with standard deviation of 6.76 years, with the highest age being 70 years and lowest 42 years. M. Rema et al. reported mean age 53±10 years.[16] Mean age of subjects without diabetic retinopathy was 58.99 years with standard deviation of 7.47 years, with the highest 74 years and lowest 40 years. M. Rema et al. reported mean age 50±10 years. [16] The mean age of diabetics with DR was significantly lesser compared to diabetics without DR. This difference in the age of both the groups was statistically significant (p=0.025).
In our study the average duration of diabetes mellitus in subjects with DR was 9.70 years with a standard deviation of 5.739. Whereas the average duration of diabetes in subjects without DR was found to be 7.01 years with a standard deviation of 4.933. It was found to be statistically significant (p=0.004).
This finding confirmed with results reported by WESDR, the biggest ophthalmological survey based study, which reported higher prevalence of DR was associated with increased duration of DM.[17] In India almost all studies have reported increased prevalence of DR with increase in duration. Dandona et al. reported almost 88% of diabetics had DR with >15 years of duration of DM.[6] This result was comparable to the CURES-2, conducted in 2006 in which the average duration of diabetes in patients with DR was 8 ± 6 years. And without DR was 5 ± 5 years. [16] Rema et. al reported increased progression of DR with increased duration of disease.[16]
In our study the average level of glycosylated haemoglobin in subjects with DR was 9.66gm/dl with a standard deviation of 1.698. Whereas the average level of glycosylated haemoglobin in subjects without DR was found to be 8.190% with a standard deviation of 1.248. It was found to be statistically significant (p<0.001). This result was comparable to UKPDS in which the authors reported a mean glycosylated haemoglobin of 7.2% and 7.0gm/dl in the retinopathic and non retinopathic group.[5] This finding was significant statistically (p<0.001). Results were also comparable to CURES- 2, in which the authors found the average HbA1c level of 9.8± 2.3% and 8.5±2.2% in the retinopathic and non retinopathic group respectively. It was significant statistically (p<0.0001). We also found an association between higher glycosylated levels in the proliferative retinopathy participants as compared to the non-proliferative retinopathics. This association was significant statistically (p<0.001).
It is imperative to improve the understanding the role of hypertension in the pathogenesis and progression of DR. It presents an opportunity to provide a more inclusive health care to diabetic patients. Though the exact mechanism of effects of hypertension on DR are not known it has been hypothesised that increased shearing stress of the blood flow causes retinal endothelial injury. It is reported around 40% of DM patients are hypertensive. Which increases to 60% by age 75. In our study, hypertension was taken as systolic BP more than 140mmHg. The diastolic BP was taken as more than 90mmHg for diagnosis. We found, the mean systolic pressure in diabetics with DR is 133.13 with standard deviation of 15.273. This was significantly higher when compared to diabetics without DR having a mean of 127. 43 with a standard deviation of 18.153. This difference was statistically significant (p=0.046). Kohner EM et al. found similar association. It reported a 2.8 times more risk of developing diabettic retinopathy with a systolic pressure more than 140 mmHg as compared to systolic pressure less than 125mmHg.[18] Although CURES-2 found no significant association between DR and the severity with hypertension and its treatment.[16] In our study, the 70 diabetics without retinopathy, the mean diastolic pressure in diabetics with DR is 80.86 with standard deviation of 9.285. This was not significantly higher when compared to diabetics without DR having a mean of 79.29 with a standard deviation of 10.811. This result was found to be statistically not significant(p=0.358). Thus according to our study diastolic pressure does not contribute to the prevalence of DR.
Diabettic macular oedema is caused by increased permeability of the retinal vessels with hard exudate deposition. Hard exudates are lipoproteins leaking from retinal vessels into the extracellular space in the outer retinal layers. But the pathophysiology of circulating lipids in causing micro vascular complications in diabetics still remains a controversy compared to the well-established correlation with macrovascular complications.
In our study, for analysis deranged dyslipidemia was taken as serum Triglyceride levels >150mg/dl, total cholesterol >160mg/dl, LDL levels >100mg/dl and HDL<40mg/dl. We compared the lipid profiles of the 70 diabetic subjects with retinopathy and 70 diabetic subjects without retinopathy. We found the mean levels of triglycerides and LDL was higher in the retinopathy group. Whereas the serum total cholesterol and HDL levels in the retinopathy group were found lower. None of the above results were statistically significant. This could be due to the normal lipid profiles reported in patients on anti dyslipidemic drugs in both groups. This can be a confounding factor and a limitation of the study. As sufficient data was not available for analysis. Rema et al. in 1984 reported an association between macular oedema and increased LDL levels.[12] WESDR XIII reported increased risk of development of retinal hard exudates with macular oedema and diminution of vision in diabetics with higher levels of total cholesterol, LDL levels. Although multiple logistic regression analysis did not show a significant association between the same.[19] Chew EY found similar association between elevated total cholesterol, LDL and triglycerides with retinal hard exudates.[20] CURES-2 evaluated the lipid profiles in 1736 diabetic patients. The authors reported increased prevalence of DR in subjects with high total cholesterol, triglycerides and non- HDL cholesterol levels. Whereas macular oedema was associated with increased LDL and non HDL cholesterol levels.[21] Sachdev N et al. found increased serum LDL and cholesterol levels were important risk factors affecting the density of retinal hard exudates.[22] Whereas SN-DREAMS in 2010 reported that only high serum cholesterol was associated with CSME.[23]
Though the pathophysiology behind the association of DR and higher BMI are not well understood, several theories have been proposed to support the same. In our study we used the Asia Pacific Guidelines for obesity by the World Health Organisation for defining obesity. Obesity was defined as BMI more than 25kg/m². We found that 40 subjects with retinopathy were overweight. 28 patients out of these were obese with BMI> 25kg/m². Whereas, the non-retinopathy group had 37 subjects who were overweight. Out of which 22 subjects were obese. Though the number of obese subjects was high in the retinopathy group, this was found to be statistically not significant (p=0.950). Chi-square analysis showed no association between BMI and diabetic retinopathy. Off the total subjects screened 45 females were overweight compared to 32 male subjects. This showed that females had more prevalence of obesity. But chi- square analysis showed that this association was not significant. The mean BMI in the retinopathy group was 23.6kg/m² and non-retinopathy group was 23.675kg/m². Klein R et al. in the WESDR study revealed controversial results. They found that underweight individual had 3 times the risk of developing DR. on the other hand they found obesity related to progression and severity of diabetic retinopathy in older patients.[24] The UKPDS study found mean BMI of 27.4kg/m² in retinopathy group and 27.7kg/m²in the non-retinopathy group which was statistically not significant(p=0.9591).[5] The difference in average BMI can be attributed to the difference in the geographical condition, race, socio-economic factors and the dietary pattern. Still similar results were reported with lesser mean BMI in the retinopathy subjects in our study as well. The Hoorn Study established an association of BMI with DR but failed to achieved statistical significance.[14] M. Rema et al. in the CURES 2 study reported mean BMI in retinopathy and non-retinopathy group as 24.0 and 25.5(p<0.0001).[16] Thus inferring that lower BMI is risk factor for DR. SN- DREAMS report no. 8 by Raman R showed higher prevalence of obesity and waist circumference in women.[25] The authors also found that higher BMI had lesser prevalence of DR compared to BMI<17kg/m² (p<0.0001). Thus concluding higher BMI offers a protective role against development and progression of DR.
Conclusion
Duration of diabetes and glycosylated haemoglobin levels affect the occurrence of retinopathy, as both the factors increase so does the prevalence of retinopathy. These factors are also responsible for increasing the severity of retinopathy and causes progression from non-proliferative to proliferative retinopathy. High prevalence of diagnosed cases of hypertension and dyslipidemia among diabetics were found. But the actual values of blood pressure and lipid levels measured might have been normal at the time of study owing to the treatment of these comorbidities. Thus the calculated prevalence of comorbidities could have been affected. No significant difference was found among the body mass index of the non-retinopathy and the retinopathy group was observed.
Source of Funding
None.
Conflict of Interest
None.
References
- S. Wild, G. Roglic, A. Green, R. Sicree, H. King. Global Prevalence of Diabetes: Estimates for the year 2000 and projections for 2030. Diabetes Care 2004. [Google Scholar]
- Praveen K. Nirmalan. Prevalence of Vitreoretinal Disorders in a Rural Population of SouthernIndia. Arch Ophthalmol 2004. [Google Scholar]
- Mohan Rema, Sundaram Premkumar, Balaji Anitha, Raj Deepa, Rajendra Pradeepa, Viswanathan Mohan. Prevalence of Diabetic Retinopathy in Urban India: The Chennai Urban Rural Epidemiology Study (CURES) Eye Study, I. Invest Ophthalmol Vis Sci 2005. [Google Scholar]
- M. Rema, M. Ponnaiya, V. Mohan. Prevalence of retinopathy in non insulin dependent diabetes mellitus at a diabetes centre in Southern India. Diabetes Res Clin Pract 1996. [Google Scholar]
- E M Kohner, S J Aldington, I M Stratton, S E Manley, R R Holman, D R Matthews. Diabetic retinopathy at diagnosis of non insulin dependent diabetes mellitus and associated risk factors. United Kingdom Prospective Diabetes Study, 30. Arch Ophthalmol 1998. [Google Scholar]
- L. Dandona, R. Dandona, T. J Naduvilath, C. A McCarty, G. N Rao. Population based assessment of diabetic retinopathy in an urban population in southern India. Br J Ophthal 1999. [Google Scholar]
- R P Maurya. Diabetic retinopathy: My brief synopsis. Ind J Clin Exp Ophth 2015. [Google Scholar]
- E M Kohner. Diabetic retinopathy. Br Med Bull 1989. [Google Scholar]
- T. Fujisawa, H. Ikegami, E. Yamato, Y. Kawaguchi, H. Ueda, M. Shintani. Association of plasma fibrinogen level and blood pressure with diabetic retinopathy, and renal complications associated with proliferative diabetic retinopathy, in Type 2 diabetes mellitus. Diabetes Med 1999. [Google Scholar]
- J N Kostraba, R Klein, J S Dorman, D J Becker, A L Drash, R E Maser. The Epidemiology of Diabetes Complications Study. IV. Correlates of diabetic background and proliferative retinopathy. Am J Epidemiol 1991. [Google Scholar]
- E Y Chew, M L Klein, F L Ferris, N A Remaley, R F Murphy, K Chantry. Association of elevated serum lipid levels with retinal hard exudates in diabetic retinopathy. Arch Ophthalmol 1996. [Google Scholar]
- R Mohan, V Mohan, L Susheela, A Ramachandran, M Viswanathan. Increased LDL cholesterol in noninsulin dependent diabetes with maculopathy. Acta Diabetol Lat 1984. [Google Scholar]
- D Katusic, M Tomic, T Jukic, R Kordic, J Sikic, N Vukojevic. Obesity - a risk factor for diabetic retinopathy in type 2 diabetes?. Coll Antropol 2005. [Google Scholar]
- H. A. van Leiden, J. M. Dekker, A. C. Moll, G. Nijpels, R. J. Heine, L. M. Bouter. Blood Pressure, Lipids, and Obesity Are Associated With Retinopathy: The Hoorn Study. Diabetes Care 2002. [Google Scholar]
- L. Zhang, G. Krzentowski, A. Albert, P. J. Lefebvre. Risk of Developing Retinopathy in Diabetes Control and Complications Trial Type 1 Diabetic Patients With Good or Poor Metabolic Control. Diabetes Care 2001. [Google Scholar]
- M. Rema, V. Mohan, R. Deepa, R. Ravikumar. Association of Carotid Intima-Media Thickness and Arterial Stiffness With Diabetic Retinopathy: The Chennai Urban Rural Epidemiology Study (CURES-2). Diabetes Care 2004. [Google Scholar]
- R Klein, M D Davis, S E Moss, B E Klein, D L Demets. The Wisconsin Epidemiologic Study of Diabetic Retinopathy. A comparison of retinopathy in younger and older onset diabetic persons. Adv Exp Med Biol 1985. [Google Scholar]
- Eva M. Kohner. United Kingdom Prospective Diabetes Study, 30. Arch Ophthalmol 1998. [Google Scholar]
- B E Klein, S E Moss, R Klein, T S Surawicz. The Wisconsin Epidemiologic Study of Diabetic Retinopathy. XIII. Relationship of serum cholesterol to retinopathy and hard exudate. Ophthalmol 1991. [Google Scholar]
- E Y Chew, M L Klein, Ferris Fl 3rd, N A Remaley, R P Murphy, K Chantry. Association of elevated serum lipid levels with retinal hard exudate in diabetic retinopathy. Arch Ophthalmol 1996. [Google Scholar]
- Puspalata Agroiya, Rajeev Philip, Sanjay Saran, Manish Gutch, Rajeev Tyagi, KeshavKumar Gupta. Association of serum lipids with diabetic retinopathy in type 2 diabetes. Indian J Endocrinol Metab 2013. [Google Scholar]
- N Sachdev, A Sahni. Association of systemic risk factors with the severity of retinal hard exudates in a north Indian population with type 2 diabetes. J Postgrad Med 2010. [Google Scholar]
- Rajiv Raman, Padmaja Kumari Rani, Vaitheeswaran Kulothungan, Sudhir Reddi Rachepalle, Govindasamy Kumaramanickavel, Tarun Sharma. Influence of Serum Lipids on Clinically Significant versus Nonclinically Significant Macular Edema. Ophthalmol 2010. [Google Scholar]
- R Klein, B E Klein, S E Moss. The Wisconsin epidemiologic study of diabetic retinopathy. III. Prevalence and risk of diabetic retinopathy when age at diagnosis is 30 or more years. Arch Ophthalmol 1984. [Google Scholar]
- Rajiv Raman, Padmaja Kumari Rani, Perumal Gnanamoorthy, R. R. Sudhir, Govindasamy Kumaramanikavel, Tarun Sharma. Association of obesity with diabetic retinopathy: Sankara Nethralaya Diabetic Retinopathy Epidemiology and Molecular Genetics Study (SN-DREAMS Report no. 8). Acta Diabetologica 2010. [Google Scholar]