Introduction
A disability is any continuing condition that restricts everyday activities. The Disability Services Act (1993) defines ‘disability’ as meaning a disability.1
Which is attributable to an intellectual, psychiatric, cognitive, neurological, sensory or physical impairment or a combination of those impairments
Which is permanent or likely to be permanent.
Which may or may not be of a chronic or episodic nature.
Which results in substantially reduced capacity of the person for communication, social interaction, learning or mobility and a need for continuing support services.
With the assistance of appropriate aids and services, the restrictions experienced by many people with a disability could be managed.
Types of disability1
The main categories of disability are physical, sensory, psychiatric, neurological, cognitive and intellectual. Many people with disabilities have multiple disabilities.
A physical disability is the most common type of disability, followed by intellectual and sensory disability. [Physical disability generally relates to disorders of the musculoskeletal, circulatory, respiratory and nervous systems.
Sensory disability involves impairments in hearing and vision.
Visual impairment definition2
-
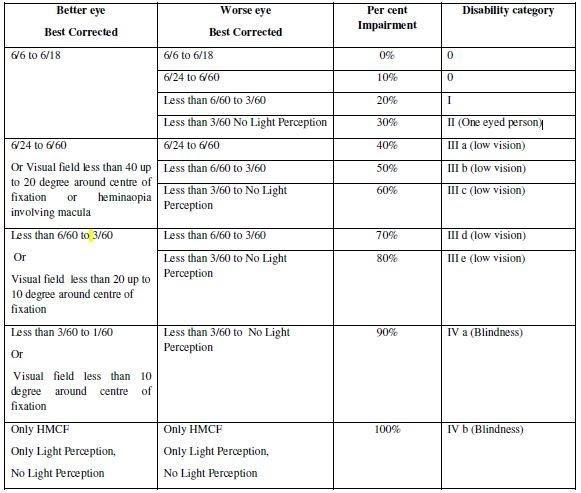
"Blindness" means a condition where a person has any of the following conditions, after best correction—
-
"Low-vision" means a condition where a person has any of the following conditions, namely:—r
The most common causes of visual impairment globally are uncorrected refractive errors (43%), cataracts (33%), and glaucoma (2%).2 Cataracts are the most common cause of blindness. Other disorders that may cause visual problems include age related macular degeneration, diabetic retinopathy, corneal clouding, childhood blindness, and a number of infections. Visual impairment can also be caused by problems in the brain due to stroke, premature birth, or trauma among others. These cases are known as cortical visual impairment.
The World Health Organization (WHO) estimates that 80% of visual impairment is either preventable or curable with treatment. This includes cataracts, the infections like river blindness and trachoma, glaucoma, diabetic retinopathy, uncorrected refractive errors, and some cases of childhood blindness. Many people with significant visual impairment benefit from vision rehabilitation, changes in their environment, and assistive devices. As of 2015 there were 940 million people with some degree of vision loss.246 million had low vision and 39 million were blind. The majority of people with poor vision are in the developing world and are over the age of 50 years. Rates of visual impairment have decreased since the 1990s. Visual impairments have considerable economic costs both directly due to the cost of treatment and indirectly due to decreased ability to work.
In India, under RPWD Act 2016, low vision is considered to be adisability. A person having benchmark disability, can avail disability benefits from the government.
Assessment of Low Vision
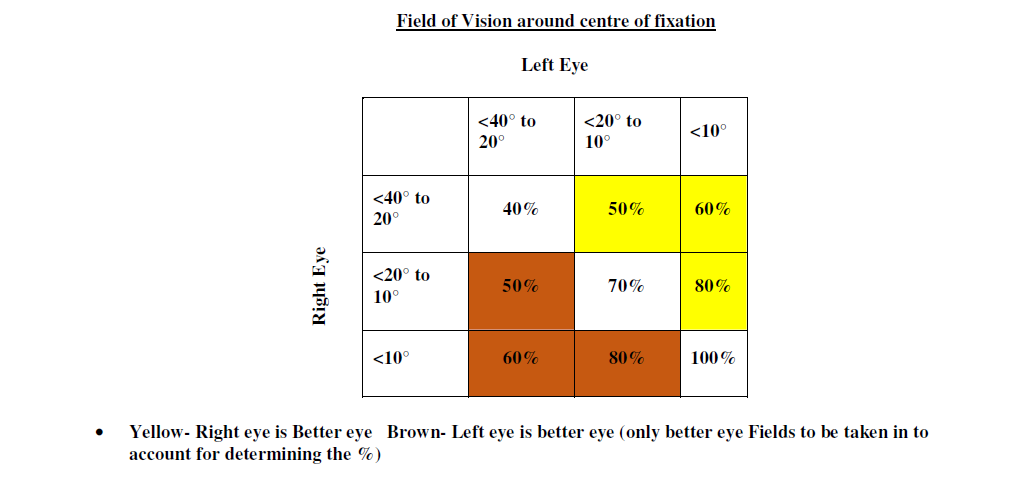
Low vision is assessed only after taking all the possible measures to correct the vision as much as possible. These measures include medical and surgical interventions and/or use of spectacles/lenses.
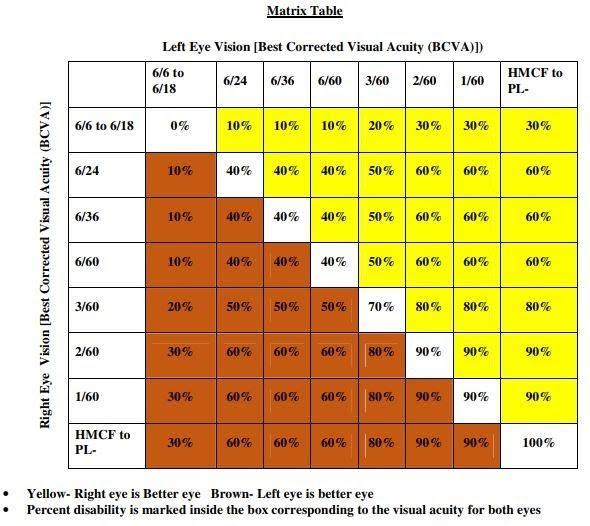
As explained in the table below, when one eye has BCVA better than 6/18, then upto disability category 2 applied.
Category 3 is considered as low vision if visual impairment is 40% it is category 3a. If visual impairment is 50% it is category 3b. If visual impairment is 60% it is category 3c. If visual impairment is 70% it is category 3d. If visual impairment is 80% it is category 3e.
Category 4 is considered as blindness if visual impairment is 90% it is category 4a.
If visual impairment is 1000% it is category 4b.
Study was done to know the demographic pattern and causative analysis in Gadag district of Karnataka. However, there are no much studies in India to compare these reports in our population. Hence, a retrospective study was conducted to study these details.
Materials and Methods
A cross-sectional study was conducted in the low vision clinic of ophthalmology department of Gadag institute of medical sciences, Gadag from 1st January 2019 TO 31st December 2019.
All the visually disabled persons of all genders were included in the study consent was taken from all the study participants. Persons with multiple disability also included if they have associated visual disability. Persons whose results may be biased are excluded viz; those less than 5 years of age, persons with disability less than 30%.
Demographic features like Age /sex, District, Taluk, Rural /urban, caste/category, education, employment, profession, marital status, family members affected, consanguinity of parents, reason for receiving certificate.
Financial status is collected.
Clinical features like Eye affected [R<>=L], Category of visual impairment.
Percentage of blindness, other disability, diagnosis –RE, diagnosis- LE, Organelle (part of the eye) involved, cause/trauma, treatment taken, whether visual acuity/visual field / both affected.
Results and Observation
In total, 323 persons were included. Persons were distributed in all age groups. There were 214/323males (66.3%) & 109/323 females (33.7%), showing male preponderance. Male to female ratio was found to be 1.96:1.
Mean age was 37.52 years.38(11.76%) persons were under the age of 15 years. 184(56.97%) persons belonged to the productive age group of 16-45 years. 101(31.27%) persons were more than the age of 45 years.
77(24%) persons belong to the general category, 198(61%) belong to other backward castes, and 48 (15%) belong to sc/st. Among the persons > 15 years, 43 (15%) graduated and 65(23%) were illiterates.
Students were 38(12%) in number and the remaining 139(43%) were employed in various ways. 146(45%) were unemployed. Among the ones who are employed mainly work as music teachers-31(9%) and agricultural coolies-35 (11%). 258(80%) belong to BPL, 29(9%) AAY and 36(11%) APL.
Among the people less than 30 years, 148(46%) were married. And 96 (30%) persons were born to consanguineous marriage. 58(18%) had family members with disabilities. 255(79%) did not have any morbidities. 23(7%), 20(6%) and 25(8%) persons had associated otolarygological, psychiatry related and orthopedic disabilities respectively.
Reason for certification was monetary benefit in 210(65%) persons, job purpose in 14 (4%) persons and to get rehabilitative appliances in 99 (31%) persons. 263(81.4%) persons were ready for rehabilitative measures.
168(52%) were blind and 155(48%) belonged to the low vision category. 25 (8%) persons, 20 (6%) persons, 20 (6%) persons, 52(16%) persons, 38(12%) persons, 11(3%) persons and 157(49%) persons were seen in the category of 3a,3b,3c,3d,3e,4a and 4b respectively.
Causes for visual disability were found to be refractive errors with amblyopia, glaucoma, uveitis, cataract, anterior segment dysgenesis and retinal pathology in 92 (28%), 21(7%), 13(4%), 32(10%) 81(25%) and 84(26%) respectively.
Etiology was found to be trauma, congenital, infection, hereditary, other diseases in 36(11%), 92(29%), 36(11%), 149(46%), 10(3%) persons respectively.
Treatment was inadequate in 40% of the cases. Visual acuity was alone affected in 36(11%) cases visual fields alone in 15(5%) cases both were affected in 271(84%) cases.
Table 1
Demographic distribution
Table 2
Social life education / employment / financial status
Table 3
Personal life
Table 4
Reason for certification
|
Reason for certification |
Number |
Percentage |
|
Monetary Benefit |
210 |
65 |
|
Job Purpose |
14 |
4 |
|
Rehabilitation Appliances (Walking stick / watch / computers) |
99 |
31 |
|
Total |
323 |
100 |
Table 5
Willingness for rehabilitation
|
Willingness for rehabilitation |
Number |
Percentage |
|
Yes |
263 |
81.4% |
|
No |
60 |
18.6% |
|
Total |
323 |
100 |
Table 6
Table 7
L etiology
|
Etiology |
Number |
Percentage |
|
Trauma |
36 |
11 |
|
Congenital |
92 |
29 |
|
Infection |
36 |
11 |
|
Hereditary |
149 |
46 |
|
Disease /pathology |
10 |
3 |
|
Total |
323 |
100 |
Discussion
There have been many studies regarding the prevalence of visual disability in different parts of India. Causes of visual impairment differ in different parts of the world depending upon the prevalence of ocular diseases in that area.4, 5, 6 These studies help in framing strategies to control and thus decrease the prevalence of blindness. By obtaining a visual handicap certificate the person can get access to various benefits provided by the Government like preferences in jobs and education, concession in travelling charges, income tax benefits.7, 8
38 (11.76%) people were under the age of 15 years which corresponds to the people seeking benefits in education. 184(56.97%) people belonged to the 16-45 yrs age group which corresponds to people utilising the benefits in seeking jobs. In our study, 214 patients (66.3%) were males and 109 patients (33.7%) were females. This indicates the number of males visiting the hospital to obtain the disability certificate was significantly higher than that of the females.
Among persons > 15 years of age, 43 (15%) graduated and 65(23%) were illiterates. 146(45%) were unemployed, which indicates their need for a disability certificate to earn their bread. Among the ones who were employed, 9% were music teachers and 11% were agricultural coolies, while 38 (12%) people belonged to the student category. Unemployment in our study was in concordance with the findings of NSSO survey.9
168(52%) patients belonged to blindness category and 155(48%) belonged to Low vision category. Similar finding was noted in a study conducted at Central Rajasthan, India.10
Reason for certification was monetary benefits in 210 (65%) persons, job purpose in 14(4%) persons and to get rehabilitative appliances in 99 (31%) persons.
Refractive errors with amblyopia (28%) followed by blindness due to retinal pathology (26%) and anterior segment dysgenesis (25%) were found to be the main causes for visual disability followed by other causes like glaucoma, uveitis, cataract. Regular school eye health screening camps are being conducted and free spectacles are being distributed to the needy by the Government. Inspite of this, rise in preventable cause of blindness can be attributed to the poor compliance by the needy.
Hereditary (46%) and congenial (29%) ranked higher amongst the etiologies for the visual disability. Poor adherence to treatment resulting in decreased vision was seen in 40% of cases.
All the above data gives discernment into the relative burden of different eye diseases. We get an overall picture of avoidable as well as unavoidable causes of blindness. We need to improve the strategies to overcome the preventable causes of blindness by increasing awareness amongst the people and emphasize the need to strictly adhere to the entire process of treatment. Studies like these help to plan, implement and monitor the eye care services.
Conclusion
Visually disabled persons in our study showed male preponderance. Few were employed as music artists and teachers. Majority were illiterates. Refractive errors and retinal pathology were major reasons. Early identification of the disease, proper treatment and counselling is needed to avoid visual disability.


