
Introduction
Surgically induced astigmatism (SIA) is a rotational and dioptric combination effect produced on the corneal geometry following cataract surgery. It occurs independently of approaching techniques that involve vector mathematics and trigonometric calculations for its meaningful and accurate understanding. The basic advantage of constructing the SIA calculator is to investigate the surgeon’s potential for modulating the techniques and to maximize consistent results with good postoperative astigmatic control.1 Therefore, to calculate SIA and to perform tedious mathematical calculations, various inbuilt programmed software incorporating all the basic vector analytical mathematics. Holladay JT et al developed ten-step methods of calculating residual refractive change by programmable calculator or personal computer.2
Samar K Basak designed vector-based SIA-Soft which is simple, accurate, and providing user-friendly statistical analysis and reported that it is less time-consuming by comparing with manual performance of class 12th students.3 A previous study on 100 eyes post LASIK showed astigmatic analysis considering target induced astigmatism vector (TIA), surgically induced astigmatism vector, and difference vector using the ASSORT or VectrAK analysis program.4 Another available system is the SIA calculator 2.1 versions, all these systems work on vector components of astigmatism. This software performs SIA calculations in all the meridians pre and post-operatively and also calculates their mean values for population studies.
A previous study investigated SIA from 12 peer-reviewed publications over 16 years and the refractive changes studied by a new method of the polar analytic system.5 This new calculator works on the basic tool of vector analysis by MS Excel which is readily available in all the systems. And solving the equations which are being practiced from our school days, thus forming a platform to calculate SIA. Determining residual astigmatism helps in choosing the right axis, right length, size, and nature of incision which is especially important for the correction of astigmatism. This may help the ophthalmologist to analyze their accuracy and predictability which will ease their work.
Materials and Methods
The study was conducted at a tertiary Health Care institution in the department of ophthalmology from May 2019 to January 2020 enrolling 29 eyes 25 patients randomly selected according to inclusion and exclusion criteria. The inclusion criterion consisted of the patients willing to give consent for the study and patients diagnosed with senile cataracts (immature, mature) undergoing temporal manual small incision cataract surgery (TSICS). Exclusion criteria are composed of other forms of cataracts of traumatic and diabetic etiology. The patients with intraoperative complications or conversion to extracapsular cataract extraction are also excluded.
Pre-operative evaluation of all selected patients performed for Visual acuity, slit-lamp biomicroscope examination, and posterior segment status in addition to the acquisition of pre and post-operative manual Keratometry Horizontal and vertical curvature values (Kh and Kv). The surgical procedure on entire selected patients executed by the same surgeon with manual keratometry measurements documented postoperatively at 6 weeks.
For evaluating the data and to estimate the surgically induced astigmatism (SIA), mathematical and trigonometry functions of MS excel are applied and the accuracy of the MS excel SIA calculator is determined with the existing SIA 2.1calculator versions. The researcher can add up to 200 cases for analysis and a detailed report is made available in the calculator.
Basic fundamental principles of MS excel calculator design
In this novel calculator, simple MS excel trigonometric functions are applied after representing Kh value as x coordinate and Kv value as y coordinate equating it for the right-angle triangle to calculate the astigmatic magnitude based on a Pythagorean formula. Consequently, the astigmatic axis is determined by finding the value for an inverse tan function that is expressed in arc tans multiplying by 2 to create a double angle vector system to cover total quadrants of the cornea after conversion to degrees. With these concepts, our current calculator has evaluated the values for configuring equations using the MS excel functions.
Work up for finding resultant SIA magnitude in the MS excel calculator
Pythagoras theorem is applied to understand and calculate the pre and post-operative SIA magnitude consequently subtracting post-operative values from pre-operative values that yielded the final resultant SIA magnitude which is computed with the existing calculators. Pythagoras theorem states that the square of the hypotenuse side is equal to the sum of squares of the other two sides in a right-angled triangle and hence hypotenuse can be calculated with known measurements of the two sides. Manual keratometry measured the horizontal (Kh) and vertical (Kv) curvatures expressed in diopters.
Therefore, in the present study, the principal meridians are represented as the two sides of a triangle to calculate the hypotenuse that is considered as the SIA magnitude. Thus, preoperative and post-operative SIA magnitude is calculated and their difference is considered as the resultant SIA magnitude which is made clear and explained below.
That is,
Hypotenuse2 = Kh2+Kv2 therefore,
Hypotenuse (SIA magnitude) = √ Kh2+Kv2 (expressed in Diopter)
For example, following data represent the preoperative keratometry values
Kh = 43 D, Kv = 44 D, substituting these values in the above equation, we get
Hypotenuse2 = Kh2+Kv2
=432+442
=1849+1936
Hypotenuse2 =3785
Hypotenuse = √3785
Pre operative SIA magnitude = 61.52 Diopters. And
Following is the postoperative keratometry values
Kh = 44 D, Kv = 45 D, substituting these values in the above equation, we get
Hypotenuse2 = Kh2+Kv2
=442+452
=1936+2025
Hypotenuse2 =3961
Hypotenuse = √3961
Post-operative SIA magnitude = 62.94 Diopters
Subtracting the preoperative SIA value from the post-operative SIA value gives the resultant SIA magnitude, thus, we get
Resultant SIA magnitude = Pre-operative SIA magnitude-Post operative SIA magnitude, substituting the values, we derived
SIA magnitude = 61.52-62.94
The resultant SIA magnitude is =-1.42 Diopters (integers are considered for statistical analysis omitting the signs)
Work up for finding resultant SIA axis in the MS excel calculator
The law of cosine is applied for calculating angle theta when the angle opposite and the other two sides are known, thus the pre and post-operative SIA axis are calculated. Thus, we have
Cosine theta = adjacent side/hypotenuse
Sine theta = opposite side/hypotenuse
These formulae are for understanding the law of cosines however we want to find out the angle theta of hypotenuse that is the SIA axis which is calculated from the tangent formula as shown below
Tan theta = opposite side (Kh)/adjacent side (Kv)
OR
Theta = tan-1 (Kh/Kv) according to the inverse tan functions
Since the astigmatic axis doubles in direction, the formula is multiplied by 2.
Final formula is
Theta = 2 tan-1 (Kh/Kv)
Example
Kh=44 Diopter, Kv=45 Diaopters, substituting these values in the formula
Theta = 2 tan-1 (44/45)
Theta = 2 tan-1 (0.98)
Theta = 2(44.42)
Theta = 88.84 degrees (practically it is equal to 90 degrees)
Thus pre and post-operative axis is determined applying this formula; however pre and postoperative axis is already measured by the keratometer, therefore it is essential to calculate the axis difference or axis rotation or steepening or flattening effects because mere subtraction of the pre and post-operative vector axis would not be practical and meaningful for axis analysis.
Results
This study included manual keratometer measurements for determining accuracy, limits of agreement, and predictability of this new SIA calculator and comparing it with the existing SIA 2.1 version. Statistical analysis is performed on representing the continuous variables as means and standard deviation while categorical variables are displayed as proportions and percentages. Pre and postoperative manual keratometer measurements for horizontal and vertical curvature measured in 29 eyes of 25 patients. The mean SIA magnitude of 0.66 (±0.47) D ranging from 0.00-1.95 and 0.64 (±0.55) D ranging from 0.00-2.30 Diopter calculated with present calculator and SIA 2.1 versions respectively.
The demographic profile included males and females with a mean age of 62.55(±8.08 years). The relationship and strength of association determined by Pearson correlation coefficient Accordingly, statistically significant difference levels set at p <0.05 on a paired two-sample t-test. Consequently, as we obtained non-normative data distribution for the SIA axis, the Wilcoxon sign rank test was applied for the analyses. The area under the ROC curve (AUC) was established for calculating the accuracy and Bland-Altman plots were employed for determining the limits of agreements (LoA) and interchangeability.
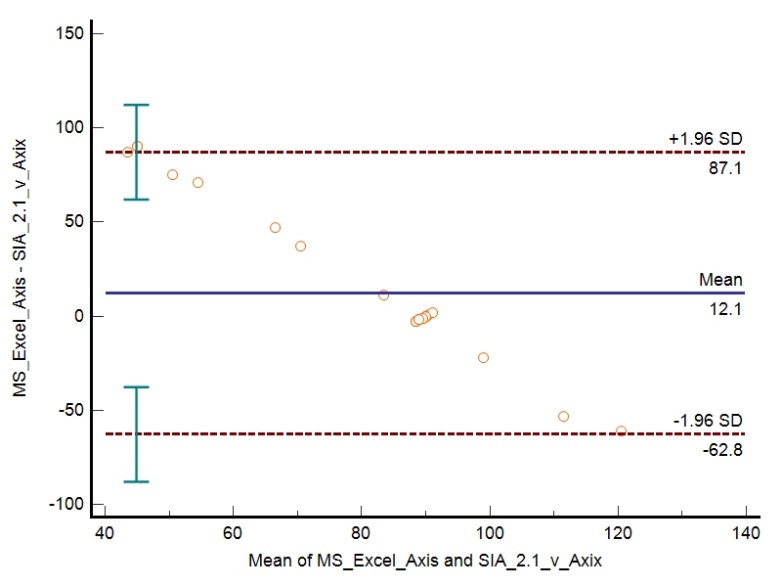
Descriptive and comparative statistics of the resultant SIA magnitude depicted in Table 1, Table 2 shows the regression analysis of dependent Y (new calculator) and independent X variables. (SIA 2.1 version) Results of ROC curve analyses and AUC calculations are shown in Table 3. Table 4 indicates Bland-Altman analysis for the systematic differences and limit of agreements for SIA magnitude. On regression analysis, a scatter plot for the distribution of data points and a best-fit line is deployed in Figure 1. Graphical representation of the ROC curve analysis is shown in Figure 2. Bland-Altman plots were applied to analyze the limit of agreements for SIA magnitude. (Figure 3) Figure 4 describes Bland-Altman difference plots revealing the data point distribution within +/- 1.96 SD and line of limits for the SIA axis.
Table 1
Showing descriptive and comparative statistics of the resultant SIA magnitude
Table 2
Showing regression analysis of Dependent Y (MS excel) and independent X variables (SIA 2.1 calculator)
|
N= 29 eyes |
Coefficient of determination (R2) |
95% CI |
t values |
p values |
Regression equation |
|
Intercept |
0.03 |
0.47 to 1.03 |
5.49 |
<0.0001 |
y = 0.7494 + -0.1388 x |
|
Slope |
|
-0.48 to 0.19 |
-0.85 |
0.40 |
|
Table 3
Showing ROC curve analysis of MS excel with SIA 2.1 version calculator
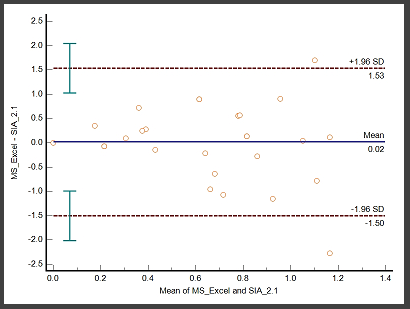
Table 4
Showing Bland-Altman analysis showing systematic differences and limit of agreements for the magnitude
|
N= 29 Eyes |
Mean |
Differences SD |
95% CI |
Lower LOA at 95% at CI |
Upper LOA at 95% at CI |
|
MS excel and SIA 2.1 calculators |
0.02 |
0.78 |
-0.29 to 0.31 |
-1.5 (-2.01 to -1.0) |
1.54 (1.03 to 2.04) |
Figure 1
Showing a scatter plot with a distribution of data points and a best-fit line on regression analysis
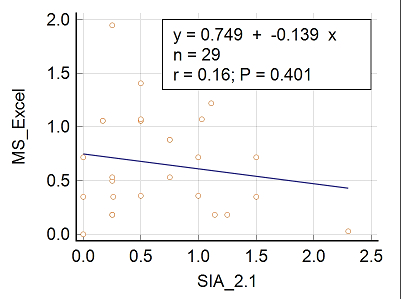
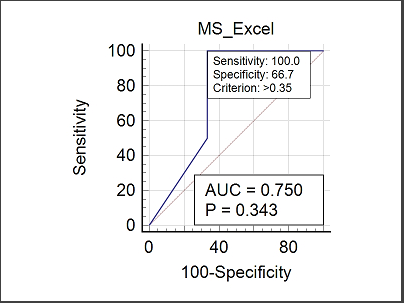
Figure 2
Showing ROC curve analysis for SIA magnitudes with SIA 2.1 version calculator as the reference variable
Discussion
For discovering the accuracy, predictability, and limits of agreement, a total of 29 eyes of 25 patients were investigated and validated with the SIA 2.1 version. Similar mean SIA magnitude, a narrow SD, and SEM demonstrated comparable results with SIA 2.1 version. Yuli Park et al evaluated 132 post-cataract eyes by polar vector analysis conversely, Pythagoras principle for the SIA magnitude calculation and inverse tan function for the axis determination applied in the present study.6 Pearson's coefficient analysis revealed either no correlation or a weak negative correlation. (Table 1)
The new calculator predicted 0.61 Diopters for every unit change in the magnitude of the SIA 2.1 version. Paired sample t-test analysis did not show a statistical difference nevertheless, revealed a statistical difference (p<0.0001) on regression analysis. (Table 2 ) ROC curve analysis displayed a good and reliable accuracy (AUC=0.75) with an acceptable range of 95% confidence intervals. (Table 3) On Bland-Altman difference plots, 95% of data points are distributed within ±1.96 SD of the line of equality achieving good limits of agreement for the SIA magnitude. As the 95% confidence intervals show a narrow range, the interchangeability of calculators may be considered. (Table 4)
Figure 1 represents a slightly negative trend for the SIA magnitude nonetheless found no statistical significance. As the ROC curve seems to drift towards the right side of the graph, greater accuracy attained with 100% sensitivity and 66.67% specificity at a cut point value of 0.35 Diopter however 50% sensitivity was obtained for values between 0.36 to 0.72 Dioptre. (Figure 2)
The two calculators may be interchangeable as 95% of data points fall within ±1.96 SD of the agreements line in addition to narrow 95% Confident intervals. (Figure 3) Wilcoxon test and z-statistics did not show a statistically significant difference (p 0.71) however, axis analysis on Bland Altman plots revealed good limits of agreements. (Figure 4 ) Based on good accuracy, limits of agreement, and acceptable interchangeability, the present MS Excel-based new calculator is validated for the clinical application.
Working of present calculator
Automatically, this novel calculator determines the SIA magnitude on entering the pre and post-operative keratometer values in the spreadsheets. The resultant SIA magnitude is calculated on entering pre and post-op SIA magnitude similar to Gauvin M et al study that developed a graphical user interface (GUI) based on the Alpins method.7 Small sample size and insufficient literature on the validity of astigmatic calculators are a few limitations of the present study.